This is an examle how to plot values for two parameters in on plot and builds upon the dta generated at this example.
So, from the features you extracted you would isolate two parameters from the dataframe:
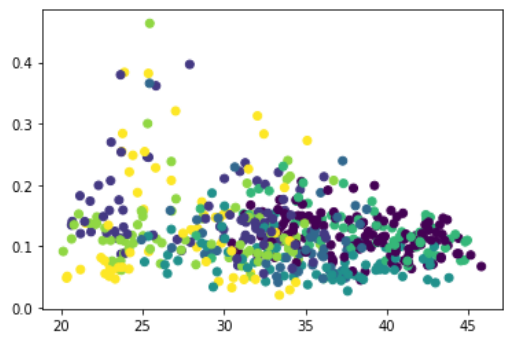
x1 = df_feats.loc[:, 'F0semitoneFrom27.5Hz_sma3nz_amean']
x2 = df_feats.loc[:, 'F0semitoneFrom27.5Hz_sma3nz_stddevNorm']
You'd need matplotlib
import matplotlib.pyplot as pltYou would color the dots according to the emotion they have been labeled with. Because the plot function does not accept string values as color designators but only numbers, you'd first have to convert them, e.g. with the LabelEncoder:
from sklearn import preprocessing
le = preprocessing.LabelEncoder()
c_vals = le.fit_transform(df_emo.emotion.values)
and then you can simply do the plot:
plt.scatter(x1, x2, c=c_vals)
plt.show()