Use python for image generation

Here are some suggestions to visualize your results with python.
The idea is mainly to put your data in a pandas dataframe and then use pandas methods to plot it.

Bar plots

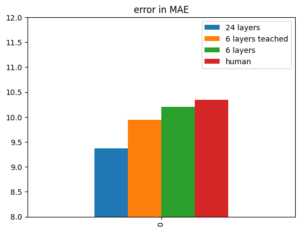
Here's the simple one with one variable:

vals = {'24 layers':9.37, '6 layers teached':9.94, '6 layers':10.20, 'human':10.34}
df_plot = pd.DataFrame(vals, index=[0])
ax = df_plot.plot(kind='bar')
ax.set_ylim(8, 12)
ax.set_title('error in MAE')

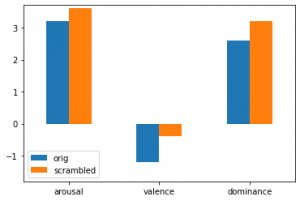
Here's an example for a barplot with two variables and three features:

vals_arou  = [3.2, 3.6]
vals_val  = [-1.2, -0.4]
vals_dom  = [2.6, 3.2]
cols = ['orig','scrambled']
plot = pd.DataFrame(columns = cols)
plot.loc['arousal'] = vals_arou
plot.loc['valence'] = vals_val
plot.loc['dominance'] = vals_dom
ax = plot.plot(kind='bar', rot=0)
ax.set_ylim(-1.8, 3.7)
# this displays the actual values
for container in ax.containers:
    ax.bar_label(container)

Stacked barplots

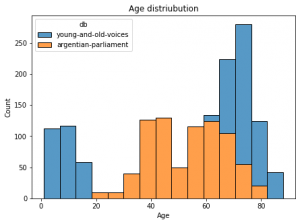
Here's an example using seaborn package for stacked barplots:
For a pandas dataframe with columns age in years and db for two database names:

import seaborn as sns
f = plt.figure(figsize=(7,5))
ax = f.add_subplot(1,1,1)
sns.histplot(data=df, ax = ax, stat="count", multiple="stack",
             x="duration", kde=False,
              hue="db",
             element="bars", legend=True)
ax.set_title("Age distriubution")
ax.set_xlabel("Age")
ax.set_ylabel("Count")

Box plots

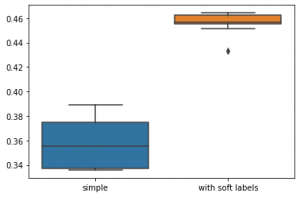
Here's a code comparing two box plots with data dots

import seaborn as sns
import pandas as pd
n = [0.375, 0.389, 0.38, 0.346, 0.373, 0.335, 0.337, 0.363, 0.338, 0.339]
e = [0.433 0.451, 0.462, 0.464, 0.455, 0.456, 0.464, 0.461 0.457, 0.456]
data = pd.DataFrame({'simple':n, 'with soft labels':e})
sns.boxplot(data = data)
sns.swarmplot(data=data, color='.25', size=1)

Confusion matrix

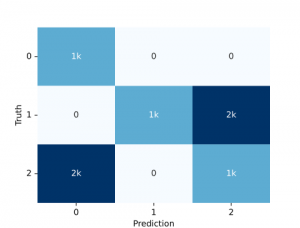
We can simply use the audplot package

from audplot import confusion_matrix

truth = [0, 1, 1, 1, 2, 2, 2] * 1000
prediction = [0, 1, 2, 2, 0, 0, 2] * 1000
confusion_matrix(truth, prediction)

Pie plot

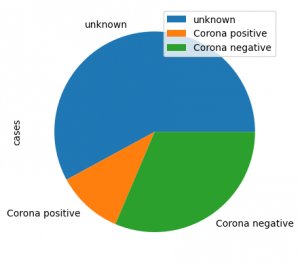
Here is an example for a pie plot

import pandas as pd

label=lst:code_fig_pie]
import pandas as pd
plot_df = 
    pd.DataFrame({'cases':[461, 85, 250]}, 
    index=['unknown', 'Corona positive', 
    'Corona negative'])
plot_df.plot(kind='pie', y='cases', autopct='%.2f')

looks like this:

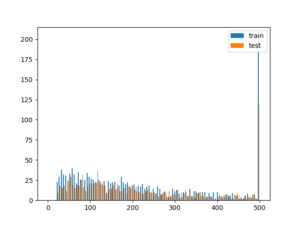
Histogram

import matplotlib.pyplot as plt
# assuming you have two dataframes with a speaker column, you could plot the histogram of samples per speaker like this 
test = df_test.speaker.value_counts()[df_test.speaker.value_counts()>0]
train = df_train.speaker.value_counts()[df_train.speaker.value_counts()>0]

plt.hist([train, test], bins = np.linspace(0, 500, 100), label=['train', 'test'])
plt.legend(loc='upper right')
# better use EPS for publication as it's vector graphics (and scales)
plt.savefig('sample_dist.eps')
How to use Latex for your project documentation

Using a documentation system that separates content and presentation has many advantages, the biggest one probably flexibility.
I vote for latex and since there is now a company that offers free latex environment, you don't have to set it up yourself (you still can, but it might be tedious).

I've set up a sample project that you should be able to copy and use as a start here:

Overleaf sample project

How to speech synthesize in German with ESPnet

Here is how to text to speech (TTS) synthesize with a German single female speaker Tacotron2 model and esp2 net

You need the python packages

pip install torch espnet_model_zoo phonemizer

Then you can run

import soundfile
from espnet2.bin.tts_inference import Text2Speech

model = 'https://zenodo.org/record/5150957/files/tts_train_tacotron2_raw_hokuspokus_phn_espeak_ng_german_train.loss.ave.zip?download=1'
text2speech = Text2Speech.from_pretrained(model)

speech = text2speech("Wow, das war ja einfach!")["wav"]
soundfile.write("out.wav", speech.numpy(), text2speech.fs, "PCM_16")

How to segment and label a speech database

Segmenting means in this case: splitting a longer audio file based on speech pauses.

This post shows you how to record, segment and then label a speech recording using the Ina speech segmenter and Labeltool.

Record audio

Firstly you need a recording. You might do that with your mobile phone or a microphone connected to your computer using, for example, Audacity.

I'd recommend recording / changing the sample rate to 16 kHz, as this is sufficient for speech recordings.

Let's say you stored your recording in the file longer_test.wav inside a directory named utterances.

Segment the recording

We start doing the segmentation in a python script.
You need some packages installed: pandas, inaSpeechSegmenter and audformat

# we start with the imports
import pandas as pd
from inaSpeechSegmenter import Segmenter
from inaSpeechSegmenter.export_funcs import seg2csv, seg2textgrid
from audformat.utils import to_filewise_index
from audformat import segmented_index

# we then use variables for our recording:
root =  './utterance/'
media = 'longer_test.wav'

# the INA speech segmenter is used very easy:
seg = Segmenter()
segmentation = seg(root+media)

# if curious, try:
print(segmentation)

# then collect the segments that were recognized as human, either female or male:
files, starts, ends = [], [], []
for entry in segmentation:
    kind = entry[0]
    start = entry[1]
    end = entry[2]
    if kind == 'female' or kind == 'male':
        print (f'{media}, {start}, {end}')
        files.append(media)
        starts.append(start)
        ends.append(end)
seg_index = segmented_index(files, starts, ends)

#  this index can now be used by audformat to acutally cut the audio file into segments
df = pd.DataFrame(index = seg_index)
file_list = to_filewise_index(df , root, 'audio_out', progress_bar = True)

# the resulting list can be stored to disk:
file_list.to_csv('file_list.csv', header=False)

Label the recording

labeling means to add metadata to the samples, for example emotional arousal.
There are hundreds of tools to do this, I use of course the one i programmed myself, Speechalyzer 😉
Here's a tutorial how to set this up and how to adapt the tool

If running on linux, you could then start the Speechalyzer with the file list you created like this:

java -jar ~/research/Speechalyzer/Speechalyzer.jar -cf ~/research/Speechalyzer/res/speechalyzer.properties -fl file_list.csv

and then simply start the Labeltool to label the files.

Speechalyzer can then export the labels to a file which can be used by Nkululeko as a labeled speech database in CSV format.