This tutorial explaines how to intitialize an audformat database object from a data collection that's store in a pandas dataframe.
You can also find an official example using emo db here
First you would need the neccessary imports:
import os                       # file operations
import pandas as pd             # work with tables
pd.set_option('display.max_rows', 10)

import audformat.define as define  # some definitions
import audformat.utils as utils    # util functions
import audformat
import pickle
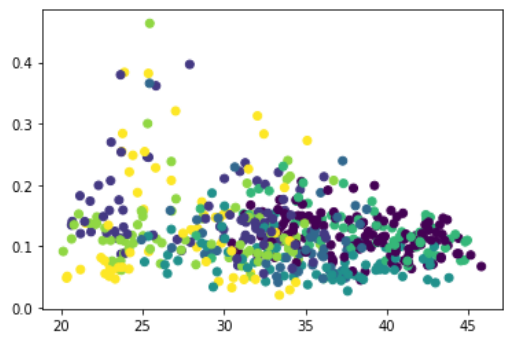
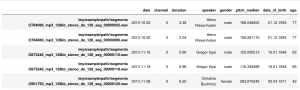
We load a sample pandas dataframe from a speech collection labeled with age and gender.
df = pickle.load(open('../files/sample_df.pkl', 'rb'))
df.head(1)
We can then construct an audformat Databse object from this data like this
# remove the absolute path to the audio samples
root = '/my/example/path/'
files = [file.replace(root, '') for file in df.index.get_level_values('file')]

# start with a general description
db = audformat.Database(
    name='age-gender-samples',
    source='intern',
    usage=audformat.define.Usage.RESEARCH,
    languages=[audformat.utils.map_language('de')],
    description=(
        'Short snippets  annotated by '
        'speaker and speaker age and gender.'
    ),
)
# add audio format information
db.media['microphone'] = audformat.Media(
    type=audformat.define.MediaType.AUDIO,
    sampling_rate=16000,
    channels=1,
    format='wav',
)
# Describe the age data
db.schemes['age'] = audformat.Scheme(
    dtype=audformat.define.DataType.INTEGER,
    minimum=0,
    maximum=100,
    description='Speaker age in years',
)
# describe the gender data
db.schemes['gender'] = audformat.Scheme(
    labels=[
        audformat.define.Gender.FEMALE,
        audformat.define.Gender.MALE,
    ],
    description='Speaker sex',
)
# describe the speaker id data
db.schemes['speaker'] = audformat.Scheme(
    dtype=audformat.define.DataType.STRING,
    description='Name of the speaker',
)
# initialize a data table with an index which corresponds to the file names
db['files'] = audformat.Table(
    audformat.filewise_index(files),
    media_id='microphone',
)
# now add columns to the table for each data item of interest (age, gender and speaker id)
db['files']['age'] = audformat.Column(scheme_id='age')
db['files']['age'].set(df['age'])
db['files']['gender'] = audformat.Column(scheme_id='gender')
db['files']['gender'].set(df['gender'])
db['files']['speaker'] = audformat.Column(scheme_id='speaker')
db['files']['speaker'].set(df['speaker'])
and finally inspect the result
db

name: age-gender-sample
description: Short snippets annotated by speaker and speaker age and gender.
source: intern
usage: research
languages: [deu]
media:
  microphone: {type: audio, format: wav, channels: 1, sampling_rate: 16000}
schemes:
  age: {description: Speaker age in years, dtype: int, minimum: 0, maximum: 100}
  gender:
    description: Speaker sex
    dtype: str
    labels: [female, male]
  speaker: {description: Name of the speaker, dtype: str}
tables:
  files:
    type: filewise
    media_id: microphone
    columns:
      age: {scheme_id: age}
      gender: {scheme_id: gender}
      speaker: {scheme_id: speaker
      }
and perhaps as a test get the unique valuesof all speakers:
db.tables['files'].df.speaker.unique()
Important: note that the path to the audiofiles needs to be relative to where the database.yaml file resides and is not allowed to start with "./", so if you do
db.files[0]
this should result in something like
audio/mywav_0001.wav