
This post is about evaluation of machine learning models, obviously the answer to the question if a model is any good depends a lot on how you test that.
Table of Contents
Criteria
Depending whether you got a classification or regression problem you can choose from a multitude of measures.
Classification
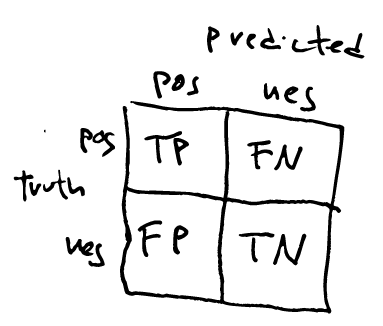
Most of these are derived from the confusion matrix:
- Confusion Matrix : Matrix with results: rows represent the real values and columns the predictions. In the binary case, the cells are called True Positive (TP), False Negative (FN: Type 2 error), False Positive (FN: Type 1 error) and True Negative (TN)
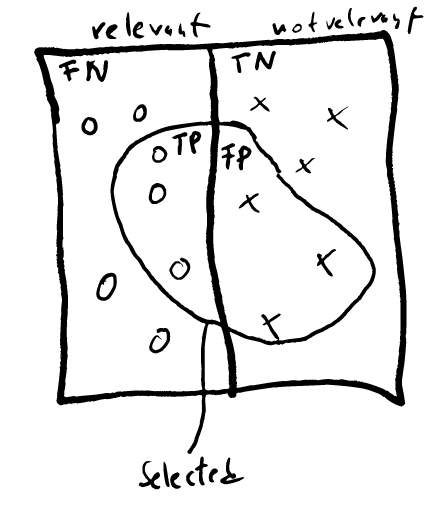
Here's a plot of cases: idea

In this figure, the circles are the relevant samples and the crosses are the not-relevant ones. Now the relevant ones that are not in the selected area are False Negatives, and the ones inside are True Positive.
And this would be the confusion matrix:
So in the example above, TP=3, FN=4, FP=3 and TN=3.
The following measurements can be derived from these:
-
Accuracy: Percentage of correct predictions -> (TP+TN)/(TP+FP+FN+TN).
-
un- / weighted Recall/Sensitivity: percentage of detected cases -> TP / (TP+FN). Can be weighted by class frequency, for multiple classes
-
un- / weighted Precision: percentage of relevant predictions -> TP / (TP+FP)
-
Specificity: Like sensitivity, but for the negative examples -> TN / (TN+FP)
-
F1: Combination of Recall and Precision -> F1 = 2 (Rec Prec)/ (Rec + Prec)
-
AUC/ROC Usually there's a tradeoff between Recall and Precision. With the Receiver Operator Curve and it's Area under curve this can be visualized by plotting the False positive rate (100-specificity) against the True positive rate (sensitivity).
Regression
-
Pearson's Pearson's Correlation Coefficient measures the similarity of two sets of numbers with the same lenght. I's a value between -1 and 1, with 0 meaning no correlation and -1 negative correlation. When plotted in 2-d space, PCC=1 would be the identity line.
-
MAE Mean absolute error: taken two sets of numbers with same length as correct and predicted values, one can compute the mean absolute error by summing up the absolute values of the pairwise differences and scale by the number of samples.
-
CCC Concordance Correlation Coefficient is a measure quite similar to PCC but tries to penalize rater bias (seeing the two distributions as truth and ratings).
Approaches
Train / test /dev splits
Best you have enough data to split it into seperate sets:
- train for the training
- dev to tune meta-parameters
- test as a final test set
Be careful to make sure that they are speaker disjunct, i.e. not have overlapping speakers, else you can't be sure if you learn general speaker characteristics or speaker idiosyncrasies.
Also it's a very good idea to have the test set from a completely different data source, so you could have more trust in the generalizability of your model.
More on the subject here
X fold cross validation
If you are low on data, you might try x fold cross validation, it means that you split your data in x (usually 10) sets with same size, and then do x trainings, using one set as dev set and the rest for train.
LOSO
Leave one Speaker out is like X fold cross-validation, but each set are all samples of one speaker. If there are many speakers, you might want Leave one speaker group out.
Both is supported by Nkululeko.