How to fix different sampling rates in a dataset with Nkululeko

With nkululeko since version 0.62.0 you can automatically adjust the sampling rate to the standard of 16 kHz, which is required by most models that might need to process your data.

A special module can be configured in the configuration file like this:

[RESAMPLE]
# which of the data splits to re-sample: train, test or all (both)
sample_selection = all
replace = True
target = data_resampled.csv

and then you call it like this

python -m nkululeko.resample --config my_config.ini

WARNING: if replace = True, this changes (overwrites) ALL files in the splits, directly on your hard disk. Make sure to make a safety copy of your database before, in case the results are undesired, or you still need the data in other sample rates.

The default value though, is replace = False . Then, the target value will be used as filename for the new dataframe with filenames that indicate that the sampling rate has been changed.

As stated above, only files in the test and train splits are affected. This means that you can use all filtering, e.g. limit samples per speaker to 20 samples to pre-select samples.

Nkululeko: how to predict labels for your data from existing models and check them

With nkululeko since version 0.58.0, you can predict labels automatically for a given database, and then perhaps use these predictions to check on bias within your data.
One example:
You have a database labeled with smokers/non-smokers. You evaluate a machine learning model, check on the features and find to your astonishment, that the mean pitch is the most important feature to distinguish between smokers and non-smokers, with a very high accuracy.
You suspect foul-play and auto-label the data with a public model predicting biological sex (called gender in Nkululeko).
After a data exploration you see that most of the smokers are female and most of the non-smokers are male.
The machine learning model detected biological sex and not smoking behaviour.

How do you do this?
Firstly, you need to predict labels. In a configuration file, state the annotations you'd like to be added to your data like this:

[DATA]
databases = ['mydata']
mydata = ... # location of the data
mydata.split_strategy = random # not important for this 
...
[PREDICT]
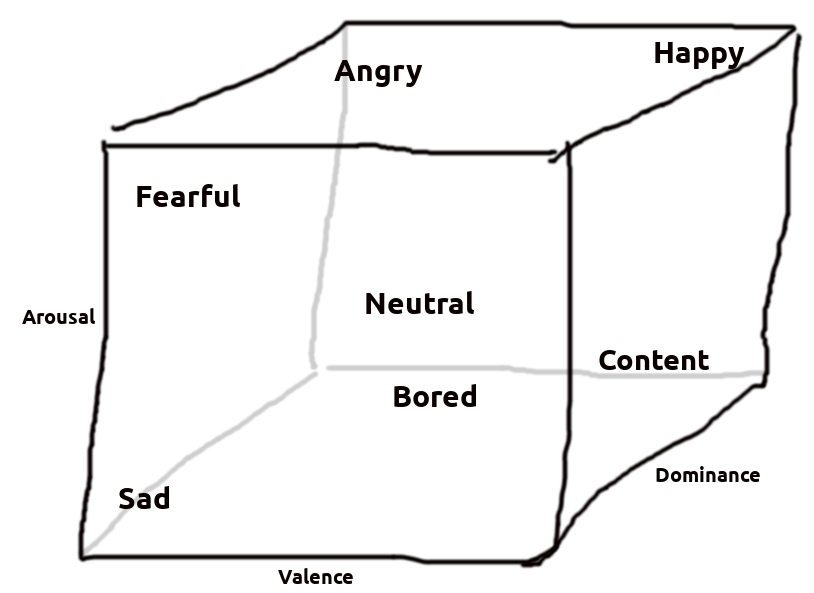
# the label names that should be predicted: possible are: 'gender', 'age', 'snr', 'valence', 'arousal', 'dominance', 'pesq', 'mos'
targets = ['gender']
# the split selection, use "all" for all samples in the database
sample_selection = all

You can then call the predict module with python:

python -m nkululeko.predict --config my_config.ini

The resulting new database file in CSV format will appear in the experiment folder.
The newly predicted values will be named with a trailing _pred, e.g. "gender_pred" for "gender"
You can than configure the explore module to visualize the the correlation between the new labels and the original target:

[DATA]
databases = ['predicted']
predicted = ./my_exp/mydata_predicted.csv
predicted.type = csv
predicted.absolute_path = True
predicted.split_strategy = random
...
[EXPL]
# which labels to investigate in context with target label
value_counts = [['gender_pred']]
# the split selection
sample_selection = all

and then call the explore module:

python -m nkululeko.explore --config my_config.ini

The resulting visualizations are in the image folder of the experiment folder.
Here is an example of the correlation between emotion and estimated PESQ (Perceptual Evaluation of Speech Quality)

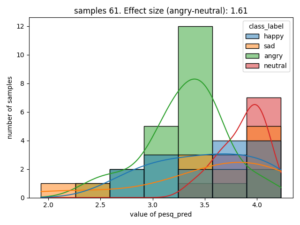
The effect size is stated as Cohen's d, for categories that have the largest value, in this case the difference of estimated speech quality is largest between the categories neutral and angry.

Nkululeko: segmenting a database

Segmenting a database means to split the audio samples of a database into smaller segments or chunks. With speech data this is usually done on the basis of VAD, aka voice activity detection, meaning that the pauses between speech in the audio samples are used as segment borders.

The reason for segmenting could be to label the data with something that would not last over the whole sample, e.g. emotional state.
Another motivation to segment audio data might be that the acoustic features are targeted at a specific stretch of audio, e.g. 3-5 seconds long.

Within nkululeko this would be done with the segment module, which is currently based on the silero software.

You simply call your experiment configuration with the segment module, and the train, test set or both will be segmented.
The advantage is, that you can use all filters on your data that might make sense beforehand, for example with the android corpus, only the reading task samples are not segmented.
You can select them like so:

[DATA]
filter = [['task', 'reading']]

and then call the segment module:

python -m nkululeko.segment --config my_conf.ini

The output is a new database file in CSV format.

If you want, you can specify if only the training, or test split, or both should be segmented, as well as the string that is added to the name of the resulting csv file (the name per default consists of the database names):

[SEGMENT]
# name postfix
target = _segmented
# which model to use
method = silero
# which split: train, test or all (both)
sample_selection = all
# the minimum lenght of rest-samples (in seconds)
min_length = 2
# the maximum length of segments, longer ones are cut here.  (in seconds)
max_length = 10

Nkululeko: check your dataset

Within nkululeko, since version 0.53.0, you can perform automatic data checks, which means that some of your data might be filtered out if it doesn't fulfill certain requirements.

Currently two checks are implemented:

[DATA]
# check the filesize of all samples in train and test splits, in bytes
 check_size = 1000
# check if the files contain speech with voice activity detection (VAD)
 check_vad = True

VAD is using silero VAD

Nkululeko: how to visualize your data distribution

If you just want to see how your data distributes on the target with nkululeko, you can do a value_counts plot with the explore module

In your config, you would specify like this:

[EXPL]
# all samples, or only test or train split?
sample_selection = all 
# activate the plot
value_counts = [['age'], ['gender'], ['duration'], ['duration', 'age']] 

and then, run this with the explore module:

python -m nkululeko.explore --config myconfig.ini

The results, for a data set with target=depression, looks similar to this for all samples:


and this for the speakers (if there is a speaker annotation)

If you prefer a kernel density estimation over a histogram, you can select this with

[EXPL]
dist_type = kde

which would result for duration to:

Nkululeko distinguishes between categorical and continuous properties, this would be the output for gender

You can show the distribution of two sample properties at once, by using a scatter plot:

In addition, this module will automatically plot the distribution of samples per speaker, per gender (if annotated):

Nkululeko: visualize clusters of your acoustic features

It can be very interesting to reduce the dimensionality of your acoustic or learned features to two or three dimensions and then color the single samples features with the label.

Nkululeko supports three different ways to reduce the dimensionality:

  • pca: Principal Componen Analysis
  • tsne: t-distributed stochastic neighbor embedding
    • perplexity=30, learning_rate=200
  • umap: Uniform Manifold Approximation and Projection
    • n_neighbors=10, random_state=0

To do this, you simply state your data and features as usual. The approaches you want to use can be set in the scatter field of the EXPL section:

[EXPL]
scatter = ['umap', 'tsne', 'pca']

(of course you don't have to use all) and then call the explore interface

python -m nkululeko.explore --config myconfig.ini

You can do this for all columns in your data, not only the target value.
If you want a scatter plot for a different target, state it like this (example):

[EXPL]
scatter = ['pca']
scatter.target = ['gender', 'age', 'likability']

And you can do it in 2 or 3-d:

[EXPL]
scatter = ['pca']
scatter.dim = 3

The images appear in the image folder of your experiment and might look like this (all from the same data):

PCA

T-SNE

UMAP

The emotion cube

There is a multitude of ways to model emotions, and some of them are collected in the EmotionML vacabularies.
Really popular with engineers and non-psychologists are two approaches:

  • discreet categories like anger, sadness, fear or joy, often associated with an intensity.
  • continuous dimensions like valence/pleasure, arousal or dominance

The emotion cube maps the emotional categories to a three dimensional space:

Nkululeko: how to augment the training set

To do data augmentation with Nkululeko, you can use the augment or the aug_train interface.
The difference is that the former only augments samples, whereas the latter augments the training set of a configuration and then immediately performs the training, including the augmented files.

In the AUGMENT section of your configuration file, you specify the method and name of the output list of file

  • traditional: is the classic augmentation, e.g. by cropping data or adding a bit of noise. We use the audiomentations package for this
  • random-splice: is a special method introduced in this paper that randomly splices and re-connects the audio samples
[AUGMENT]
# select the samples to augment: either train, test, or all
sample_selection = train
# select the method(s)
augment = ['traditional', 'random_splice']
# file name to store the augmented data (can then be added to training)
result = augmented.csv

and then call the interface:

python -m nkululeko.augment --config myconfig.ini

or

python -m nkululeko.aug_train--config myconfig.ini

if you want to run a training in the same run.

Currently, apart from random-splicing, Nkululeko simply uses the audiomentations module, i.e.:

[AUGMENT]
augment = ['traditional']
augmentations = Compose([
AddGaussianNoise(min_amplitude=0.001, max_amplitude=0.05),
Shift(p=0.5),
BandPassFilter(min_center_freq=100.0, max_center_freq=6000),])

These manipulations are applied randomly to your training set.

You should find the augmented files in the storage folder of the result folder of your experiment and could listen to them there.

Once you augmentations have been processed, you can add them to the training in a new experiment:

[DATA]
databases = ['original data', 'augment']
augment = my_augmentations.csv
augment.type = csv
augment.split_strategy = train

Supervised vs. unsupervised

Supervised vs. unsupervised

means the distinction whether your training data is annotated (or labeled) with respect to your task. An example: If you want to build a machine learner for human age estimation based on speech, you might give an algorithm a lot of examples of human speech annotated with the age of the person. This would be your training data and the approach would be supervised (by the age annotations). With unsupervised learning, you would give an algorithm simply a lot of human speech data and might ask it to cluster the data, based on differences. And might hope that the resulting clusters coincide with age.

Nkululeko exercise

-> Nkululeko: install the Berlin Emodb

This database contains examples of labels:

  • emotion and gender labels as categorical data, for classification
  • age labels as numerical data, for regression

Nkululeko: show feature importance

Since version 0.40, Nkululeko can now show the best performing X acoustic features according to some model.

There is a new section call EXPL (short for exploration), and you could state

[EXPL]
model = tree
sample_num = 15

in your config file, and then run the exploration module like this:

python -m nkululeko.explore --config my_config.ini

The resulting list will then appear in the result folder and a barplot image in the image folder.

Afterwards you could inspect single features as described here