All posts by felix

Predict emodb emotions with a Multi Layer Perceptron ANN

This post shows you how to classify emotions with a Multi Layer Perceptron (MLP) artificial neural net based on the torch framework (a different very famous ANN framework would be Keras).

Here's a complete jupyter notebook for your convenience.

We start with some imports, you need to install these packages, e.g. with pip, before you run this code:

import audformat
import numpy as np
import pandas as pd
import matplotlib.pyplot as plt
import torch
import os
import opensmile
from sklearn.preprocessing import LabelEncoder
from sklearn.preprocessing import StandardScaler
from sklearn.metrics import recall_score

Then we need to download and prepare our sample dataset, the Berlin emodb:

# get and unpack the Berlin Emodb emotional database if not already there
if not os.path.isdir('./emodb/'):
    !wget -c https://tubcloud.tu-berlin.de/s/8Td8kf8NXpD9aKM/download
    !mv download emodb_audformat.zip
    !unzip emodb_audformat.zip
    !rm emodb_audformat.zip
# prepare the dataframe
db = audformat.Database.load('./emodb')
root = './emodb/'
db.map_files(lambda x: os.path.join(root, x))    
df_emotion = db.tables['emotion'].df
df = db.tables['files'].df
# copy the emotion label from the the emotion dataframe to the files dataframe
df['emotion'] = df_emotion['emotion']

As neural nets can only deal with numbers, we need to encode the target emotion labels with numbers:

# Encode the emotion words as numbers and use this as target 
target = 'enc_emo'
encoder = LabelEncoder()
encoder.fit(df['emotion'])
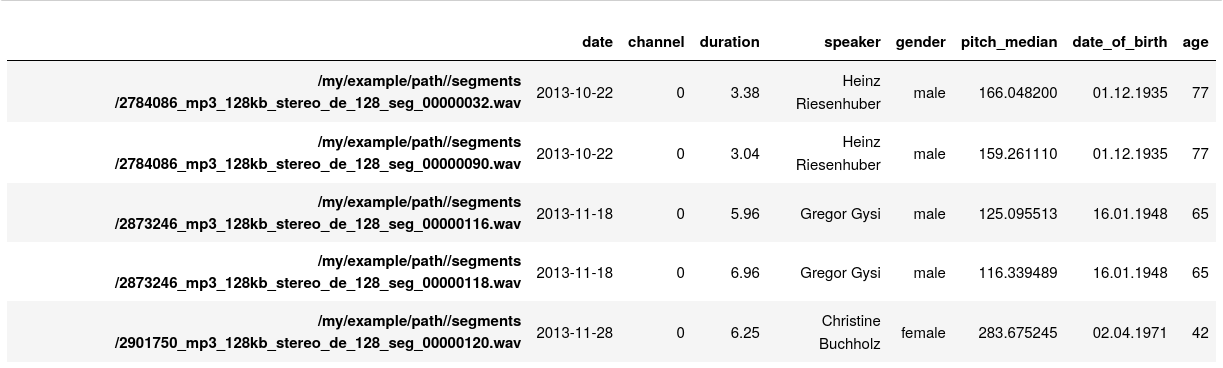
df[target] = encoder.transform(df['emotion'])

Now the dataframe should look like this:
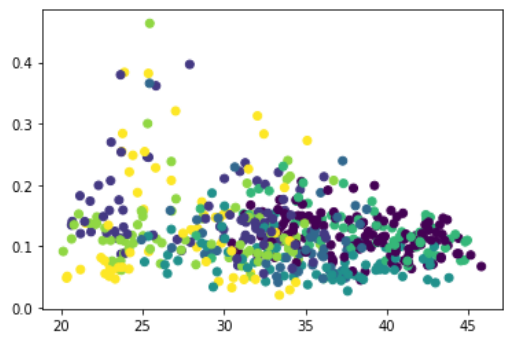
df.head()

To ensure that we learn about emotions and not speaker idiosyncrasies we need to have speaker disjunct training and development sets:

# define fixed speaker disjunct train and test sets
train_spkrs = df.speaker.unique()[5:]
test_spkrs = df.speaker.unique()[:5]
df_train = df[df.speaker.isin(train_spkrs)]
df_test = df[df.speaker.isin(test_spkrs)]

print(f'#train samples: {df_train.shape[0]}, #test samples: {df_test.shape[0]}')
#train samples: 292, #test samples: 243

Next, we need to extract some acoustic features:

# extract (or get) GeMAPS features
if os.path.isfile('feats_train.pkl'):
    feats_train = pd.read_pickle('feats_train.pkl')
    feats_test = pd.read_pickle('feats_test.pkl')
else:
    smile = opensmile.Smile(
        feature_set=opensmile.FeatureSet.GeMAPSv01b,
        feature_level=opensmile.FeatureLevel.Functionals,
    )
    feats_train = smile.process_files(df_train.index)
    feats_test = smile.process_files(df_test.index)
    feats_train.to_pickle('feats_train.pkl')
    feats_test.to_pickle('feats_test.pkl')

Because neural nets are sensitive to large numbers, we need to scale all features with a mean of 0 and stddev of 1:

# Perform a standard scaling / z-transformation on the features (mean=0, std=1)
scaler = StandardScaler()
scaler.fit(feats_train)
feats_train_norm = pd.DataFrame(scaler.transform(feats_train))
feats_test_norm = pd.DataFrame(scaler.transform(feats_test))

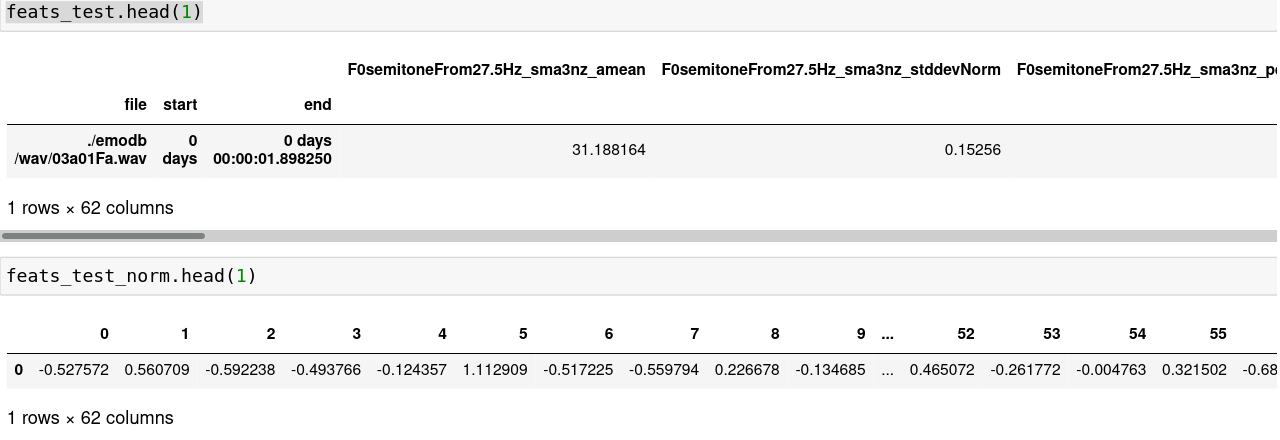
Next we define two torch dataloaders, one for the training and one for the dev set:

def get_loader(df_x, df_y):
    data=[]
    for i in range(len(df_x)):
       data.append([df_x.values[i], df_y[target][i]])
    return torch.utils.data.DataLoader(data, shuffle=True, batch_size=8)
trainloader = get_loader(feats_train_norm, df_train)
testloader = get_loader(feats_test_norm, df_test)

We can then define the model, in this example with one hidden layer of 16 neurons:

class MLP(torch.nn.Module):
    def __init__(self):
        super().__init__()
        self.linear = torch.nn.Sequential(
            torch.nn.Linear(feats_train_norm.shape[1], 16),
            torch.nn.ReLU(),
            torch.nn.Linear(16, len(encoder.classes_))
        )
    def forward(self, x):
        # x: (batch_size, channels, samples)
        x = x.squeeze(dim=1)
        return self.linear(x)

We define two functions to train and evaluate the model:

def train_epoch(model, loader, device, optimizer, criterion):
    model.train()
    losses = []
    for features, labels in loader:
        logits = model(features.to(device))
        loss = criterion(logits, labels.to(device))
        losses.append(loss.item())
        optimizer.zero_grad()
        loss.backward()
        optimizer.step()
    return (np.asarray(losses)).mean()

def evaluate_model(model, loader, device, encoder):
    logits = torch.zeros(len(loader.dataset), len(encoder.classes_))
    targets = torch.zeros(len(loader.dataset))
    model.eval()
    with torch.no_grad():
        for index, (features, labels) in enumerate(loader):
            start_index = index * loader.batch_size
            end_index = (index + 1) * loader.batch_size
            if end_index > len(loader.dataset):
                end_index = len(loader.dataset)
            logits[start_index:end_index, :] = model(features.to(device))
            targets[start_index:end_index] = labels

    predictions = logits.argmax(dim=1)
    uar = recall_score(targets.numpy(), predictions.numpy(), average='macro')
    return uar, targets, predictions

Next we initialize the model and set the loss function (criterion) and optimizer:

device = 'cpu'
model = MLP().to(device)
criterion = torch.nn.CrossEntropyLoss()
optimizer = torch.optim.Adam(model.parameters(), lr=0.0001)
epoch_num = 250
uars_train = []
uars_dev = []
losses = []

We can then do the training loop over the epochs:

for epoch in range(0, epoch_num):
    loss = train_epoch(model, trainloader, device, optimizer, criterion)
    losses.append(loss)
    acc_train = evaluate_model(model, trainloader, device, encoder)[0]
    uars_train.append(acc_train)
    acc_dev, truths, preds = evaluate_model(model, testloader, device, encoder)
    uars_dev.append(acc_dev)
# scale the losses so they fit on the picture
losses = np.asarray(losses)/2

Next we might want to take a look at how the net performed with respect to unweighted average recall (UAR):

plt.figure(dpi=200)
plt.plot(uars_train, 'green', label='train set') 
plt.plot(uars_dev, 'red', label='dev set')
plt.plot(losses, 'grey', label='losses/2')
plt.xlabel('eopchs')
plt.ylabel('UAR')
plt.legend()
plt.show()

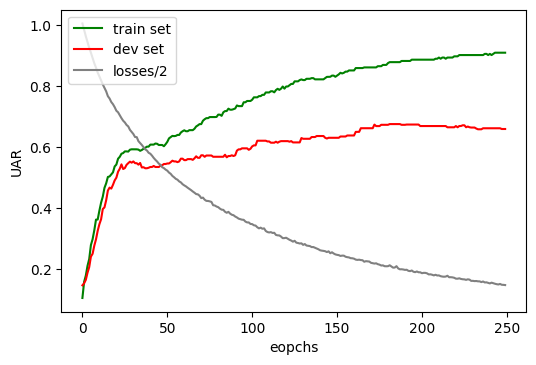
And perhaps see the resulting confusion matrix:

from sklearn.metrics import ConfusionMatrixDisplay
from sklearn.metrics import confusion_matrix
cm = confusion_matrix(truths, preds,  normalize = 'true')
disp = ConfusionMatrixDisplay(confusion_matrix=cm, display_labels=encoder.classes_).plot(cmap='gray')

Make a t-SNE plot

This post shows you how to generate a t-distributed stochastic neighbor embedding (t-SNE) plot with the opensmile features extracted from emodb data (which is explained in more detail in a previous blog post).

A t-SNE plot is a very useful visualization, as it condenses your feature space into two dimensions (so it can be plotted) and then uses colors to represent the class membership. This means, if you can identify clusters of same colored dots in your data cloud, the features are able to separate the classes.

We need the following imports:

import audformat
from sklearn.manifold import TSNE
import numpy as np
import pandas as pd
import seaborn as sns
import matplotlib.pyplot as plt
import os
import opensmile

First, you download and prepare emodb:

# get and unpack the berlin Emodb emotional database
!wget -c https://tubcloud.tu-berlin.de/s/LzPWz83Fjneb6SP/download
!mv download emodb_audformat.zip
!unzip emodb_audformat.zip
!rm emodb_audformat.zip
# preapare the dataframe
db = audformat.Database.load('./emodb')
root = './emodb/'
db.map_files(lambda x: os.path.join(root, x))
df = db.tables['emotion'].df

Then, you extract the geMAPS features:

smile = opensmile.Smile(
    feature_set=opensmile.FeatureSet.GeMAPSv01b,
    feature_level=opensmile.FeatureLevel.Functionals,
)
feats_df = smile.process_files(df.index)

And finally, you generate the t-SNE plot with the sklearn library like this:

# Plot a TSNE
def plotTsne(feats, labels, perplexity=30, learning_rate=200):
    model = TSNE(n_components=2, random_state=0, perplexity=perplexity, learning_rate=learning_rate)
    tsne_data = model.fit_transform(feats)
    tsne_data_labs = np.vstack((tsne_data.T, labels)).T
    tsne_df = pd.DataFrame(data=tsne_data_labs, columns=('Dim_1', 'Dim_2', 'label'))
    sns.FacetGrid(tsne_df, hue='label', size=6).map(plt.scatter, 'Dim_1', 'Dim_2').add_legend()
    plt.show()
plotTsne(feats_df, df['emotion'], 30, 200)

It seems that these features are useful to distinguish at least the category anger from the rest.

You might want to fiddle around with the two main parameters of the algorithm: perplexity and learning-rate.

A python class to predict your emotions

This is a post to introduce you to the idea of encapsulating functionality with object-oriented programming.

We simply put the emotional classification of speech that was demonstrated in this post in a python class like this:

import opensmile
import os
import audformat
from sklearn import svm
import sounddevice as sd
import soundfile as sf
from scipy.io.wavfile import write

class EmoRec():
    root = './emodb/'
    clf = None
    filename = 'emorec.wav'
    sr = 16000
    def __init__(self):
        self.smile = opensmile.Smile(
            feature_set=opensmile.FeatureSet.GeMAPSv01b,
            feature_level=opensmile.FeatureLevel.Functionals,
        )
        if not os.path.isdir(self.root):
            self.download_emodb()
        db = audformat.Database.load(self.root)
        db.map_files(lambda x: os.path.join(self.root, x))
        self.df_emo = db.tables['emotion'].df
        self.df_files = db.tables['files'].df
        if not self.clf:
            self.train_model()

    def download_emodb(self):
        os.system('wget -c https://tubcloud.tu-berlin.de/s/LzPWz83Fjneb6SP/download')
        os.system('mv download emodb_audformat.zip')
        os.system('unzip emodb_audformat.zip')
        os.system('rm emodb_audformat.zip')

    def train_model(self):
        print('training a model...')
        df_feats = self.smile.process_files(self.df_emo.index)
        train_labels = self.df_emo.emotion
        train_feats =  df_feats
        self.clf = svm.SVC(kernel='linear', C=.001)
        self.clf.fit(train_feats, train_labels)
        print('done')

    def classify(self, wavefile):
        test_feats = self.smile.process_file(wavefile)
        return self.clf.predict(test_feats)

    def classify_from_micro(self, seconds):
        self.record(seconds)
        return self.classify(self.filename)[0]

    def record(self, seconds):
        data = sd.rec(int(seconds * self.sr), samplerate=self.sr, channels=1)
        sd.wait()  
        write(self.filename, self.sr, data)

def main():
    test = EmoRec()
    print(test.classify_from_micro(3))

if __name__ == "__main__":
    main()

To try this you could store the above in a file called , for example, 'emorec.py' and then in a jupyter notebook, call the constructor

import emorec
emoRec = emorec.EmoRec()

and use the functionality

result = emoRec.classify_from_micro(3)
print(f'emodb thinks your emotion is {result}')

Seminar: Analyze speech for emotional expression

This post is a seminar idea sketch. I try to think up a concept for a seminar and link other blog posts from here if they can help to solve the tasks.

Here's a collection of software recommendations that you might want to install /try before the seminar.

Tasks

Get a recording

  • Record a speech of yourself of 3-5 minutes length on a topic that you find emotinally challenging, meaning something you feel strongly about. try to express your feelings while you speak.
  • Obviously you might use some other emotional recordings that you collect.
  • Convert all into a dedicated audio format, usually 16 kHz sample rate, mono channel, >= 16bit quantization should suffice.
  • You might consider storing your data in audformat to be comaptibel with further investigations.

Segment the recording

Perform a segmentation on your recording into parts that have about the right size to carry an emotional expression.

  • In a dialog situation a segment would come naturally as it would correspond to the speech segments alternating between the dialog partners (and then would be called a "turn").
  • A typical lenght is about 3-7 seconds
  • The segmentation can be done manually, via a segmentation tool like Praat, Wavesurfer or even Audacity.
  • An alternative approach is to segment the speech automatically, e.g. by a VAD (voice activity detection) algorithm. A quick search delivers e.g. this software based on Praat or the ina spech segmenter

I wrote a new tutorial on how to segment the data using the ina speech segmenter

Annotate the recording

Decide on a target

  • Which emotion(s) should be analysed?
  • Typically, with emotions, you distinguish between categories (like anger, friendlyness, sadness) and dimensions like pleasure, arousal or dominance (also known as PAD space).
  • If you want to compare across participants it's important you have the same concept of what is your target. Typical candidates would be interest, nervousness or valence.

Decide on a scale

  • There's a whole standard recommendation on the topic of how to describe emotional states.
  • Basically, for this seminar you got to decide if it's binary (0/1, on/off, true/false) or graded, like a discreet value on a Likert scale or simply a continuous value in the range [0, 1] or [-1, 1] (also a surprisingly difficult question)
  • Related to that: with respect to Likert scales the most important question is wether there's a neutral value or not.

Do the annotations

  • The process of assigning a value to a recording is called annotating, labeling or judging.
  • As you decide on a subjective value that depends on your self (temporarily as well as in general) this needs to be done in a real world scenario by as many people as possible (a number between 5 and 20 is quite common).
  • How well this works depends on the target and can be computed by the inter-rater-variability, i.e. the degree the labelers agree with each other. Typical measures for this would be Kappa value or Krippendorff's alpha.
  • The result of the labeling is a list of the segments with their labels, usually a csv file with as many lines as segments.
  • You can do this manually (listen to all segments with your favourite audioplayer and fill the list) or use a tool, e.g. Praat, or (obviously I recommend my own tool) the Speechalyzer, which has been developed to support the annotation of very large datasets.
  • An alternative to annotation would be to use a different physical measure that corresponds well with physical arousal as reference, e.g. physical data like blood pressure skin conductivity or respiration rate.
  • Of course there's also the possibility to do a continous annotation, i.e disregard segments in favour of a fixed frame size (typically below a second)

Load your data with a data processing environment

  • With respect to an environment to run the experiments in, I'd recommend python and jupyter notebooks
  • There's a great python module named pandas that you should get familar with. You will learn not only for this seminar, but be able to process any data in a computer for the rest of your existence!

Extract acoustic features

  • To perform an acoustic analysis you need to extract some kind of features related to acoustics.
  • I distinguish here acoustic from linguistic, i.e. I'd treat transcribed words (and their sentiment) as a different modality.
  • I differentiate between three kinds of features:
    • expert features meaning manually selected features that should make sense for the target at hand, e.g. kind of everything you would compute with Praat or the about 80 GeMAPS features.
    • brute-force features everything you got at hand: usually a combination of frame-based low-level descriptors (one frame: ~ 10-25 msec, a series of values) and statistical functionals, e.g. the 6000+ ComParE16 features. Leave the decision on what is important to an algorithmic approach, e.g. factor analysis.
    • learned features Embeddings computed by an ANN encoder (artificial neural net). These features can usually not be interpreted but can be used in machine learning and are an example for representation learning , end-to-end learning and transfer learning, e.g. the TRILL features.
  • You can extract/describe features manually (e.g. get speaking time, number of pauses, etc.)
  • or use an automated software, for example

Analysis

You might want to collect all data from the seminar participants in a common pandas dataframe to be able to generalize your findings across individual speakers.

  • The most obvious question you can try to answer is: is there a correlation between my emotion value (the dependent variable) and the features that I observe?
  • Another one would be to look at the effect of independent variables, i.e. other attributes of the speech like speaker, speaker traits (age, sex, dialect), languages.

Statistical measures

  • Perform analyses on the most important features for the target
  • Compute correlation coefficients for these features

Visualization

  • Find good visualizations for correlations
    • scatter plots
    • box/violin plot per level of target
    • cluster plots, clustering the levels of target expressed in color values in a two dimensional feature space (simply use two features or perform a dimensionality reduction algorithm on the features, e.g. a PCA)

Machine learning

  • Try automatic prediction of your dependent variable based on the data as test data or split into train and test if you got enough. If you split up the data, be sure not to have the same speakers in train and test set, because otherwise you will only learn some ideosyncratic expression of the speakers.

How to set up a python project

These are some general best practise tips how to organize your seminar project.

Optional: Set up a git account

git is a software that safes your work on the internet so you can always go back to earlier versions if something goes wrong. A bit like a backup system, but also great for collaborative work.

  • install the "git" software on your computer
  • go to github.com (or try gitlab.org) and get yourself an account.
  • make there a new repository, and name it e.g. my-sample-project
  • if it's a Python project, select the pathon template for the .gitignore file (this will ignore typical python temporary files for upload).
  • go to the main repository page, open the "code" dropdown button and cope the "clone" URL.
  • On your computer in a shell/terminal/console, go where your project should reside (I strongly encourage to use a path without whitespace in it) and type
    git clone <URL>

    and the project folder should be created and is linked with the git repository.

  • learn about the basic git commands by searching for a quick tutorial (git cheat sheet).

install python

  • install a python version, use version >= 3.6

this depends a lot on your operating system.
For Mac and windows it might be enough to type python in your application search and then follow the instructions for installation, if not already installed.

set up a virtual environment

  • creat a project folder
  • enter your project folder,
    cd my-sample-project
  • create a virtual environment that will contain all the python packages that you use in your project:
    virtualenv -p python3 my-project_env

    If virtualenv is not installed, you can either install it or create the environment with

    python3 -m venv my-project_env
  • then activate the environment
    ./my-project_env/bin/activate

    (might be different for other operating systems)

  • you should recognize the activated environment by it's name in brackets preceding the prompt, e.g. something like
    (my-project_env) user@system:/bla/path/$

Get yourself a python IDE

IDE means 'integrated desktop environment' and is something like a very comfortable editor for python source files. If you already know and use one of the many, I wouldn't know a reason to switch. If not, I'd suggest you take a look at VSC, the visual studio code editor as it's free of costs, available on many platforms and can be extended with many available plugins.

I've made a screencast (in German) on how to install python and jupyter notebooks on Windows

How to install Speechalyzer/Labeltool

I wrote a java tool to annotate/transcribe speech data and would like to show in this blog how to run on your system.

First of all, the software is programmed in Java, so you need a java installation on your system, there are two flavours:

  • a JDK (java development kit) would be one to use if you plan to program in Java,
  • a JRE (Java runtime environment) is sufficient to run programs written in Java such as the Speechalyzer. so both (JDK or JRE) work

To test wether you got Java on your system you might want to open a shell/terminal/console (i.e. a window where you can type in system commands) and type

java -version

which either should output a response from the Java interpreter displaying the version or an error message that the program is not installed. As Java is requested to run Speechalyzer, please make sure it is installed.

The next step would be to download the Speechalyzer which actually comes as two softwares:

  • Speechalyzer is the main program which acts as a server to process audio files and actually can be run standalone.
  • Labeltool is the GUI client for Speechalyzer and can be started when Speechalyzer is running to interact with the program via point and click.

To install the programs, click on the links above, click on the "code" dropdown menues on the github pages and select either "as zip file" or use git. If you don't know git I strongly recommend to learn about it and use it it's a mighty tool to version and backup your work, but for now let's assume you use zip.

Save the zip files somewhere on your computer hard disk, perhaps create an own folder "programs" or "research" on your user home folder.

Unzip both folders.

Both of them have configuration files which should be edited with an arbitrary text editor.

Speechalyzer has a file called "speechalyzer.properties" which is located in the "res" folder in the main folder. So if you work with a linuy system, you might want to type

cd Speechalyzer-master
pico res/speechalyzer.properties

and change at least the values for "file type" and "sample rate" to something that makes sense for your audio files.

To adapt the Labeltool to your needs is a bit more complicated so I wrote an own blog post on this

If all went well you're set up and could try the Speechalyzer by printing out its useage in the shell:

java -jar Speechalyzer.jar -h

There are two options to load audio files:
1) copy them to the "recording" directory in the Speechalyzer folder
2) specify the path at startup:

java -jar Speechalyzer.jar -rd /path/to/my/audio/files

either way, you should see a startup message from the program stating how many files where loaded.

You might then want to open another shell/console/terminal, navigate to the Labeltool folder and start to program with

java -jar Labeltool.jar

which should results in a startup window with loaded audio files:

How to adapt Speechalyzer/labeltool to your own labels/experiments

I wrote a java tool to annotate/transcribe speech data and would like to show in this blog how to edit the configuration for an adapted layout of the GUI (Labeltool is the GUI of Speechalyzer).
If you start Labeltool without a Speechalyzer server running it should give an error but for tis demonstration it could be ignored:

java -jar Labeltool.jar 

Your GUI might look like this or different, it depends on the configuration. The configuration is a text file called labeltool.config that should reside in the same folder like Labeltool.jar. You can open it with a text editor of your choice:

and in the upper section you can try out to hide or show GUi panels by setting the switches to true or false.
You can not switch off the Label panel as this is the most basic of Labeltool and always there. In the lower section you would find some button configurations:

So the categoryNames field decides which button series is shown (I hope the rest is self explanatory).
In the example config I depicted above, the Labeltool would look like this (if you closed and re-opened the GUI):

MInd, If you set

withRecoderControl=false

you will not be able to see the play button, but you still can play files by pressing Alt-p

Plot two parameters for categories

This is an examle how to plot values for two parameters in on plot and builds upon the dta generated at this example.
So, from the features you extracted you would isolate two parameters from the dataframe:

x1 = df_feats.loc[:, 'F0semitoneFrom27.5Hz_sma3nz_amean']
x2 = df_feats.loc[:, 'F0semitoneFrom27.5Hz_sma3nz_stddevNorm']

You'd need matplotlib

import matplotlib.pyplot as plt

You would color the dots according to the emotion they have been labeled with. Because the plot function does not accept string values as color designators but only numbers, you'd first have to convert them, e.g. with the LabelEncoder:

from sklearn import preprocessing
le = preprocessing.LabelEncoder()
c_vals = le.fit_transform(df_emo.emotion.values)

and then you can simply do the plot:

plt.scatter(x1, x2, c=c_vals)
plt.show()

How to create an audformat Database from a pandas Dataframe

This tutorial explaines how to intitialize an audformat database object from a data collection that's store in a pandas dataframe.
You can also find an official example using emo db here

First you would need the neccessary imports:

import os                       # file operations
import pandas as pd             # work with tables
pd.set_option('display.max_rows', 10)

import audformat.define as define  # some definitions
import audformat.utils as utils    # util functions
import audformat
import pickle

We load a sample pandas dataframe from a speech collection labeled with age and gender.

df = pickle.load(open('../files/sample_df.pkl', 'rb'))
df.head(1)


We can then construct an audformat Databse object from this data like this

# remove the absolute path to the audio samples 
root = '/my/example/path/'
files = [file.replace(root, '') for file in df.index.get_level_values('file')]

# start with a general description
db = audformat.Database(
    name='age-gender-samples',
    source='intern',
    usage=audformat.define.Usage.RESEARCH,
    languages=[audformat.utils.map_language('de')],
    description=(
        'Short snippets  annotated by '
        'speaker and speaker age and gender.'
    ),
)
# add audio format information
db.media['microphone'] = audformat.Media(
    type=audformat.define.MediaType.AUDIO,
    sampling_rate=16000,
    channels=1,
    format='wav',
)
# Describe the age data
db.schemes['age'] = audformat.Scheme(
    dtype=audformat.define.DataType.INTEGER,
    minimum=0,
    maximum=100,
    description='Speaker age in years',
)
# describe the gender data
db.schemes['gender'] = audformat.Scheme(
    labels=[
        audformat.define.Gender.FEMALE,
        audformat.define.Gender.MALE,
    ],
    description='Speaker sex',
)
# describe the speaker id data
db.schemes['speaker'] = audformat.Scheme(
    dtype=audformat.define.DataType.STRING,
    description='Name of the speaker',
)
# initialize a data table with an index which corresponds to the file names
db['files'] = audformat.Table(
    audformat.filewise_index(files),
    media_id='microphone',
)
# now add columns to the table for each data item of interest (age, gender and speaker id)
db['files']['age'] = audformat.Column(scheme_id='age')
db['files']['age'].set(df['age'])
db['files']['gender'] = audformat.Column(scheme_id='gender')
db['files']['gender'].set(df['gender'])
db['files']['speaker'] = audformat.Column(scheme_id='speaker')
db['files']['speaker'].set(df['speaker'])

and finally inspect the result

db

name: age-gender-sample
description: Short snippets annotated by speaker and speaker age and gender.
source: intern
usage: research
languages: [deu]
media:
  microphone: {type: audio, format: wav, channels: 1, sampling_rate: 16000}
schemes:
  age: {description: Speaker age in years, dtype: int, minimum: 0, maximum: 100}
  gender:
    description: Speaker sex
    dtype: str
    labels: [female, male]
  speaker: {description: Name of the speaker, dtype: str}
tables:
  files:
    type: filewise
    media_id: microphone
    columns:
      age: {scheme_id: age}
      gender: {scheme_id: gender}
      speaker: {scheme_id: speaker
      }

and perhaps as a test get the unique valuesof all speakers:

    db.tables['files'].df.speaker.unique()

Important: note that the path to the audiofiles needs to be relative to where the database.yaml file resides and is not allowed to start with "./", so if you do

db.files[0]

this should result in something like

audio/mywav_0001.wav