As shown in this post, with Nkululeko you can select only specific features from your features sets by specifying them in the [FEAT] section:
[FEATS]
features = ['JitterPCA', 'meanF0Hz', 'hld_sylRate']
What you can also do, is plotting them per category (only for classification), by specifying in the PLOT section if you would like that for all samples or only test or train samples:
[EXPL]
# turn it on
feature_distributions = True
# use only training samples
sample_selection = train
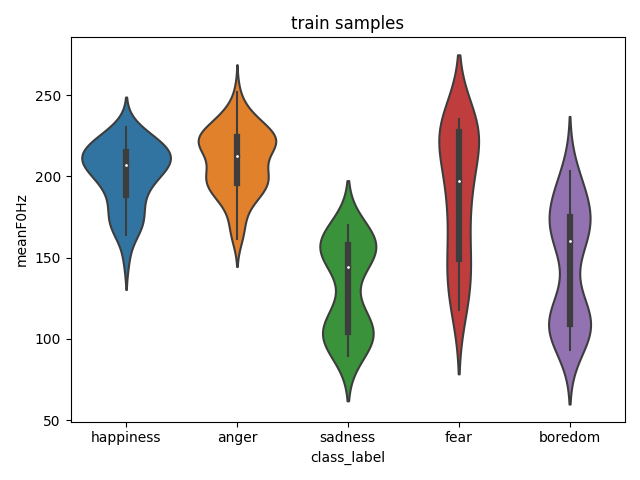
# only plot the 5 most important features
max_feats = 5 You would have to call nkululeko with the explore interface:
python -m nkululeko.explore --config <myConfig.ini>The image file is in the image folder and should look similar to this: