This post shows you how to generate a t-distributed stochastic neighbor embedding (t-SNE) plot with the opensmile features extracted from emodb data (which is explained in more detail in a previous blog post).
A t-SNE plot is a very useful visualization, as it condenses your feature space into two dimensions (so it can be plotted) and then uses colors to represent the class membership. This means, if you can identify clusters of same colored dots in your data cloud, the features are able to separate the classes.
We need the following imports:
import audformat
from sklearn.manifold import TSNE
import numpy as np
import pandas as pd
import seaborn as sns
import matplotlib.pyplot as plt
import os
import opensmile
First, you download and prepare emodb:
# get and unpack the berlin Emodb emotional database
!wget -c https://tubcloud.tu-berlin.de/s/LzPWz83Fjneb6SP/download
!mv download emodb_audformat.zip
!unzip emodb_audformat.zip
!rm emodb_audformat.zip
# preapare the dataframe
db = audformat.Database.load('./emodb')
root = './emodb/'
db.map_files(lambda x: os.path.join(root, x))
df = db.tables['emotion'].df
Then, you extract the geMAPS features:
smile = opensmile.Smile(
    feature_set=opensmile.FeatureSet.GeMAPSv01b,
    feature_level=opensmile.FeatureLevel.Functionals,
)
feats_df = smile.process_files(df.index)
And finally, you generate the t-SNE plot with the sklearn library like this:
# Plot a TSNE
def plotTsne(feats, labels, perplexity=30, learning_rate=200):
    model = TSNE(n_components=2, random_state=0, perplexity=perplexity, learning_rate=learning_rate)
    tsne_data = model.fit_transform(feats)
    tsne_data_labs = np.vstack((tsne_data.T, labels)).T
    tsne_df = pd.DataFrame(data=tsne_data_labs, columns=('Dim_1', 'Dim_2', 'label'))
    sns.FacetGrid(tsne_df, hue='label', size=6).map(plt.scatter, 'Dim_1', 'Dim_2').add_legend()
    plt.show()
plotTsne(feats_df, df['emotion'], 30, 200)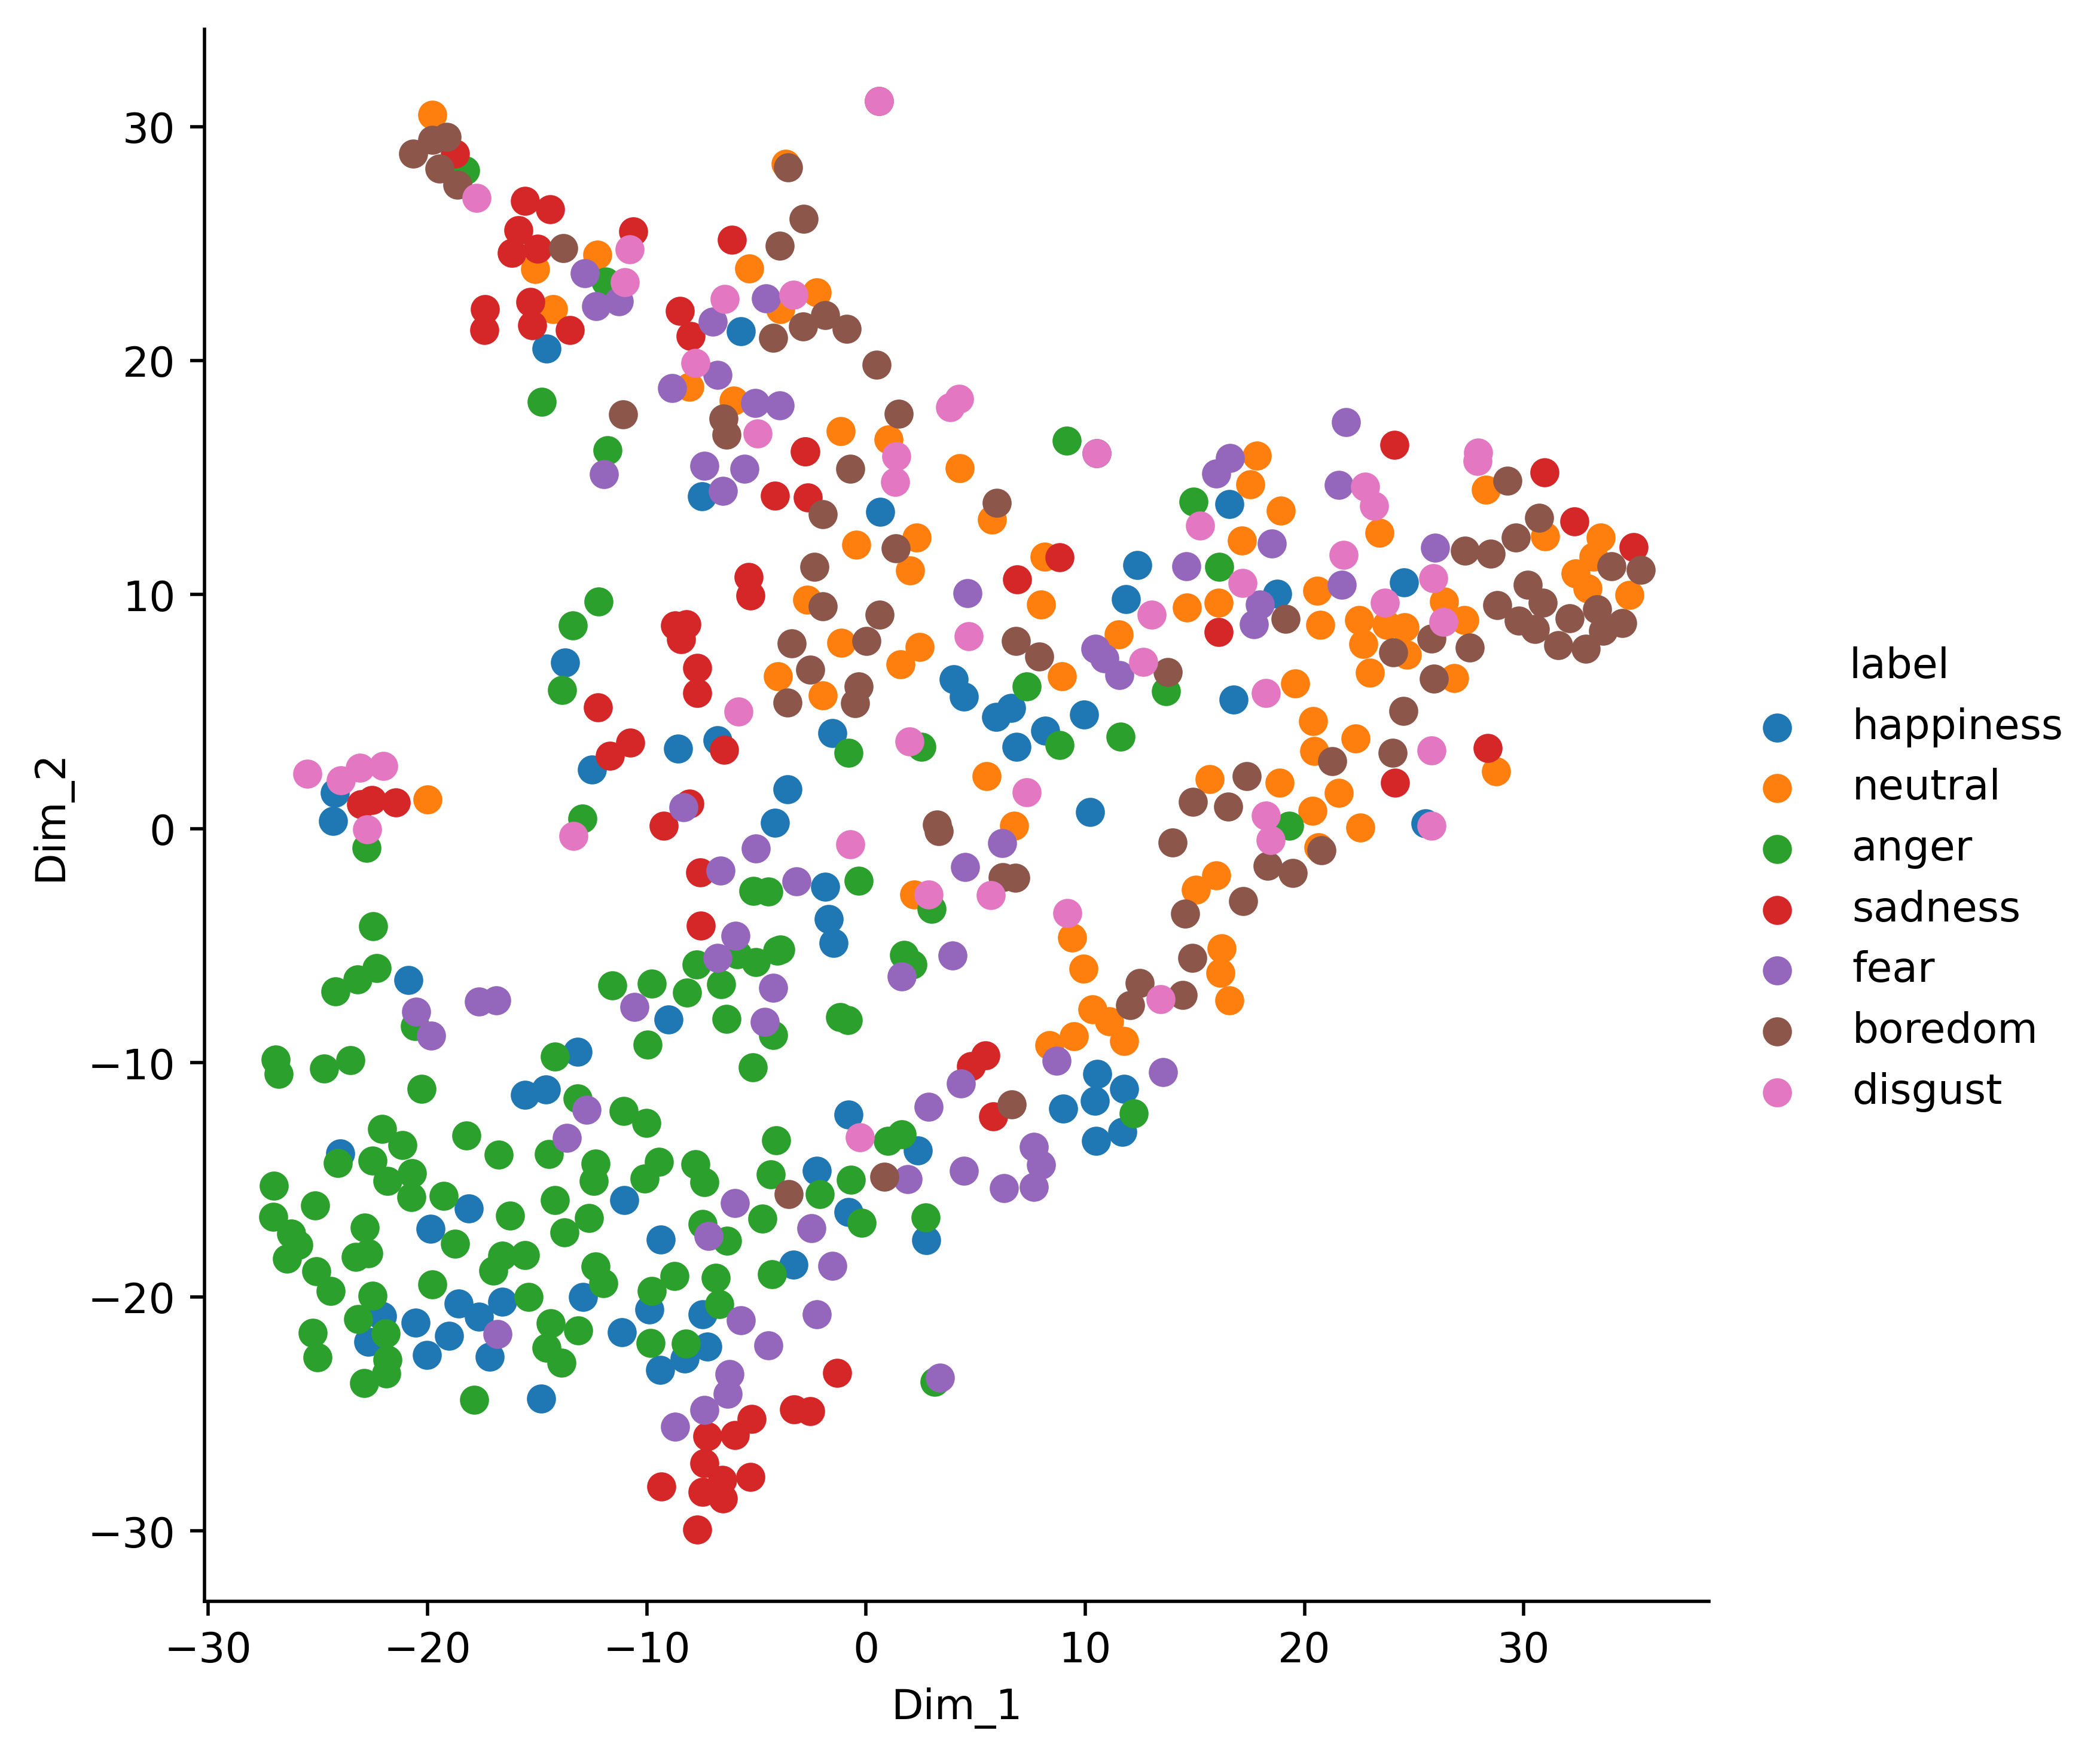
It seems that these features are useful to distinguish at least the category anger from the rest.
You might want to fiddle around with the two main parameters of the algorithm: perplexity and learning-rate.